

I built a tool because I was tired of losing the same argument.
There is a meeting I have had on nearly every Dynamics 365 project. The client says the system is slow. We open the monitoring, and the monitoring says response times are fine. Everyone looks at everyone else. Nothing gets fixed and we book another session for next month.
It's easy to assume that one side is wrong. Both are right. They are measuring different things.
Two things called performance
What the machine does. How long a request takes. Objective, measurable, and the thing that ends up in a service level agreement.
What the user feels. How long the screen sits there doing nothing after they click. Whether the interface locks up without telling them. Whether they end up clicking the same button three times because nothing happened.
These come apart more often than you would think. A form can pull its data back in 300 milliseconds and still feel broken, because the screen stayed blank for a second and a half before anything appeared. The agent does not care that the query was fast. They watched an empty screen and concluded the system was slow, which, from where they were sitting, it was.
Nothing I had access to measured the second one. So I built something that measures both and reports the distance between them.
What it is
A browser extension. It runs in Edge and Chrome, watches a Dynamics 365 model-driven app from the user's seat, and produces a report you can hand to someone.
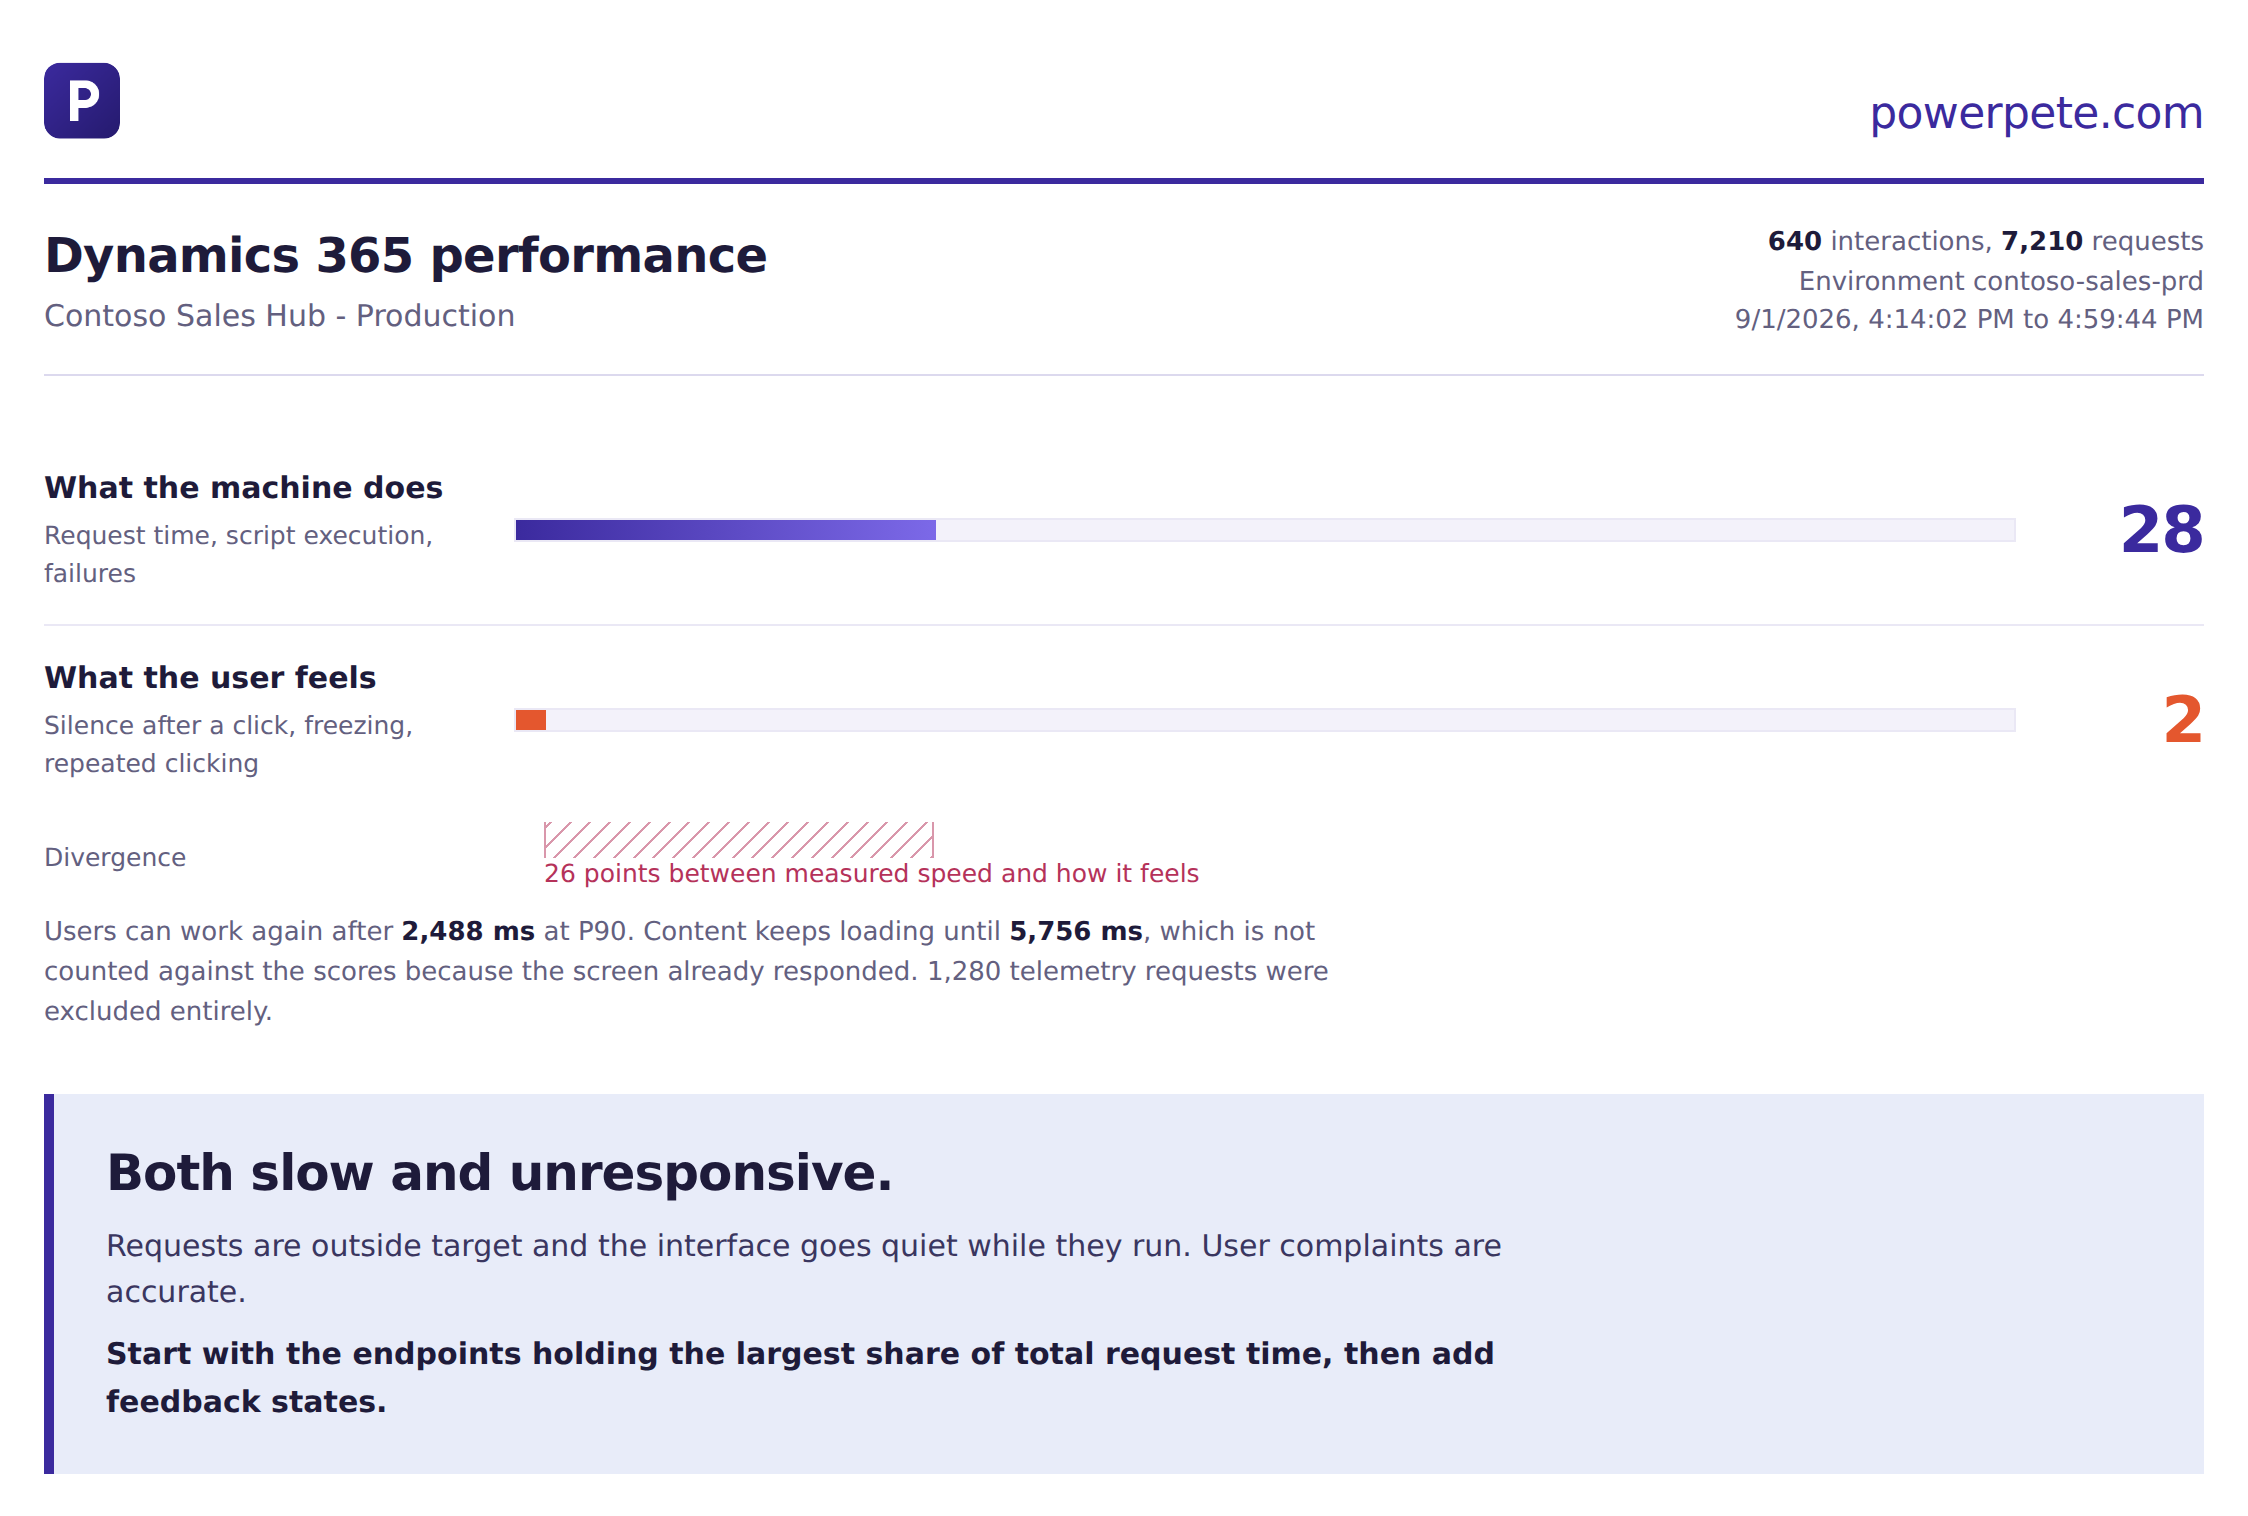
Two scores. One for measured speed, one for how responsive it feels. The number between them is the argument you have been having.
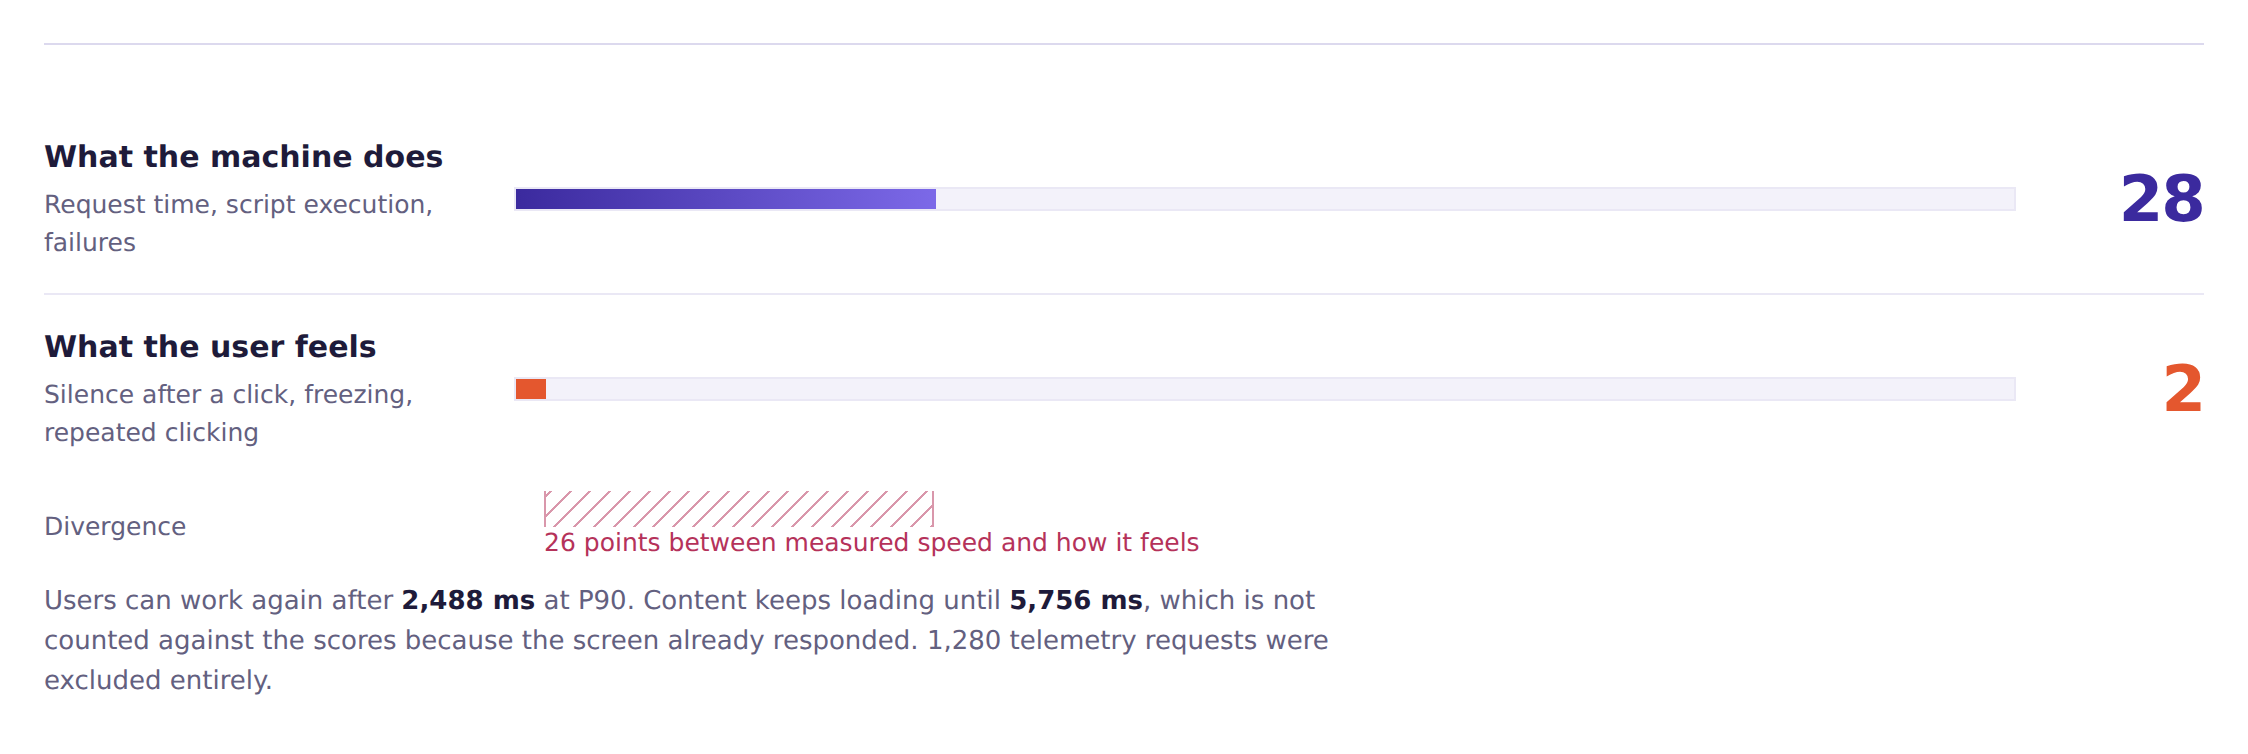
Under that, a verdict in one sentence. "The platform is fast enough, the feedback is not" is a completely different problem from "both slow and unresponsive", and they need different people to fix them.
Everything stays on the machine. One browser permission, storage. No outbound requests. I wanted something I could run in a client tenant on a Tuesday afternoon without a security conversation first.
Counting the right requests
This is the part that decides whether the numbers are worth anything, and it is where naive measurement falls over.
Open a case form in Dynamics and the browser fires a lot of traffic. Only some of it is traffic anyone is waiting for.
Telemetry beacons go out to Microsoft's diagnostics pipeline. A Fluid relay session stays open in the background for collaboration. The timeline pulls its records. The AI summary calls SummarizeRecord. Copilot reads seven separate configuration tables. Most of that starts after the form is already on screen and usable, and some of it never blocked anyone in the first place.
Count all of it and a perfectly usable screen reads as a six-second failure. Worse, a four-second telemetry beacon keeps the interaction open, so everything landing behind it gets swept into the same number. You end up measuring "when did the browser finally go quiet", which nobody in the world cares about.
So requests get sorted three ways:
- Blocking. The user is genuinely waiting on this. Scored.
- Post-render. Started after the screen already responded. Timeline, AI summary, Copilot config. Counted toward "fully loaded", never scored.
- Background. Telemetry beacons, diagnostics pipelines, collaboration transport, anything sent with
keepaliveorsendBeacon. Excluded completely, and it cannot hold an interaction open.
The headline number is time until the user can work again. That is the one worth putting in an SLA. "Fully loaded" sits next to it for context and never affects a score. A big gap between the two is normal and usually a sign the app is doing the right thing: render first, fill in the detail after.
On a typical case form that distinction is worth several seconds. It is the difference between a report that starts a useful conversation and one that gets dismissed in the first five minutes, because the client's architect knows perfectly well their form is not taking six seconds and now doubts everything else on the page.
Naming the cause, not just the number
A number on its own starts an argument. A number with an explanation attached ends one.
The report includes findings. Each one states what the capture actually shows, what usually produces that pattern, three things to check next, who owns it, and roughly how much work it is.
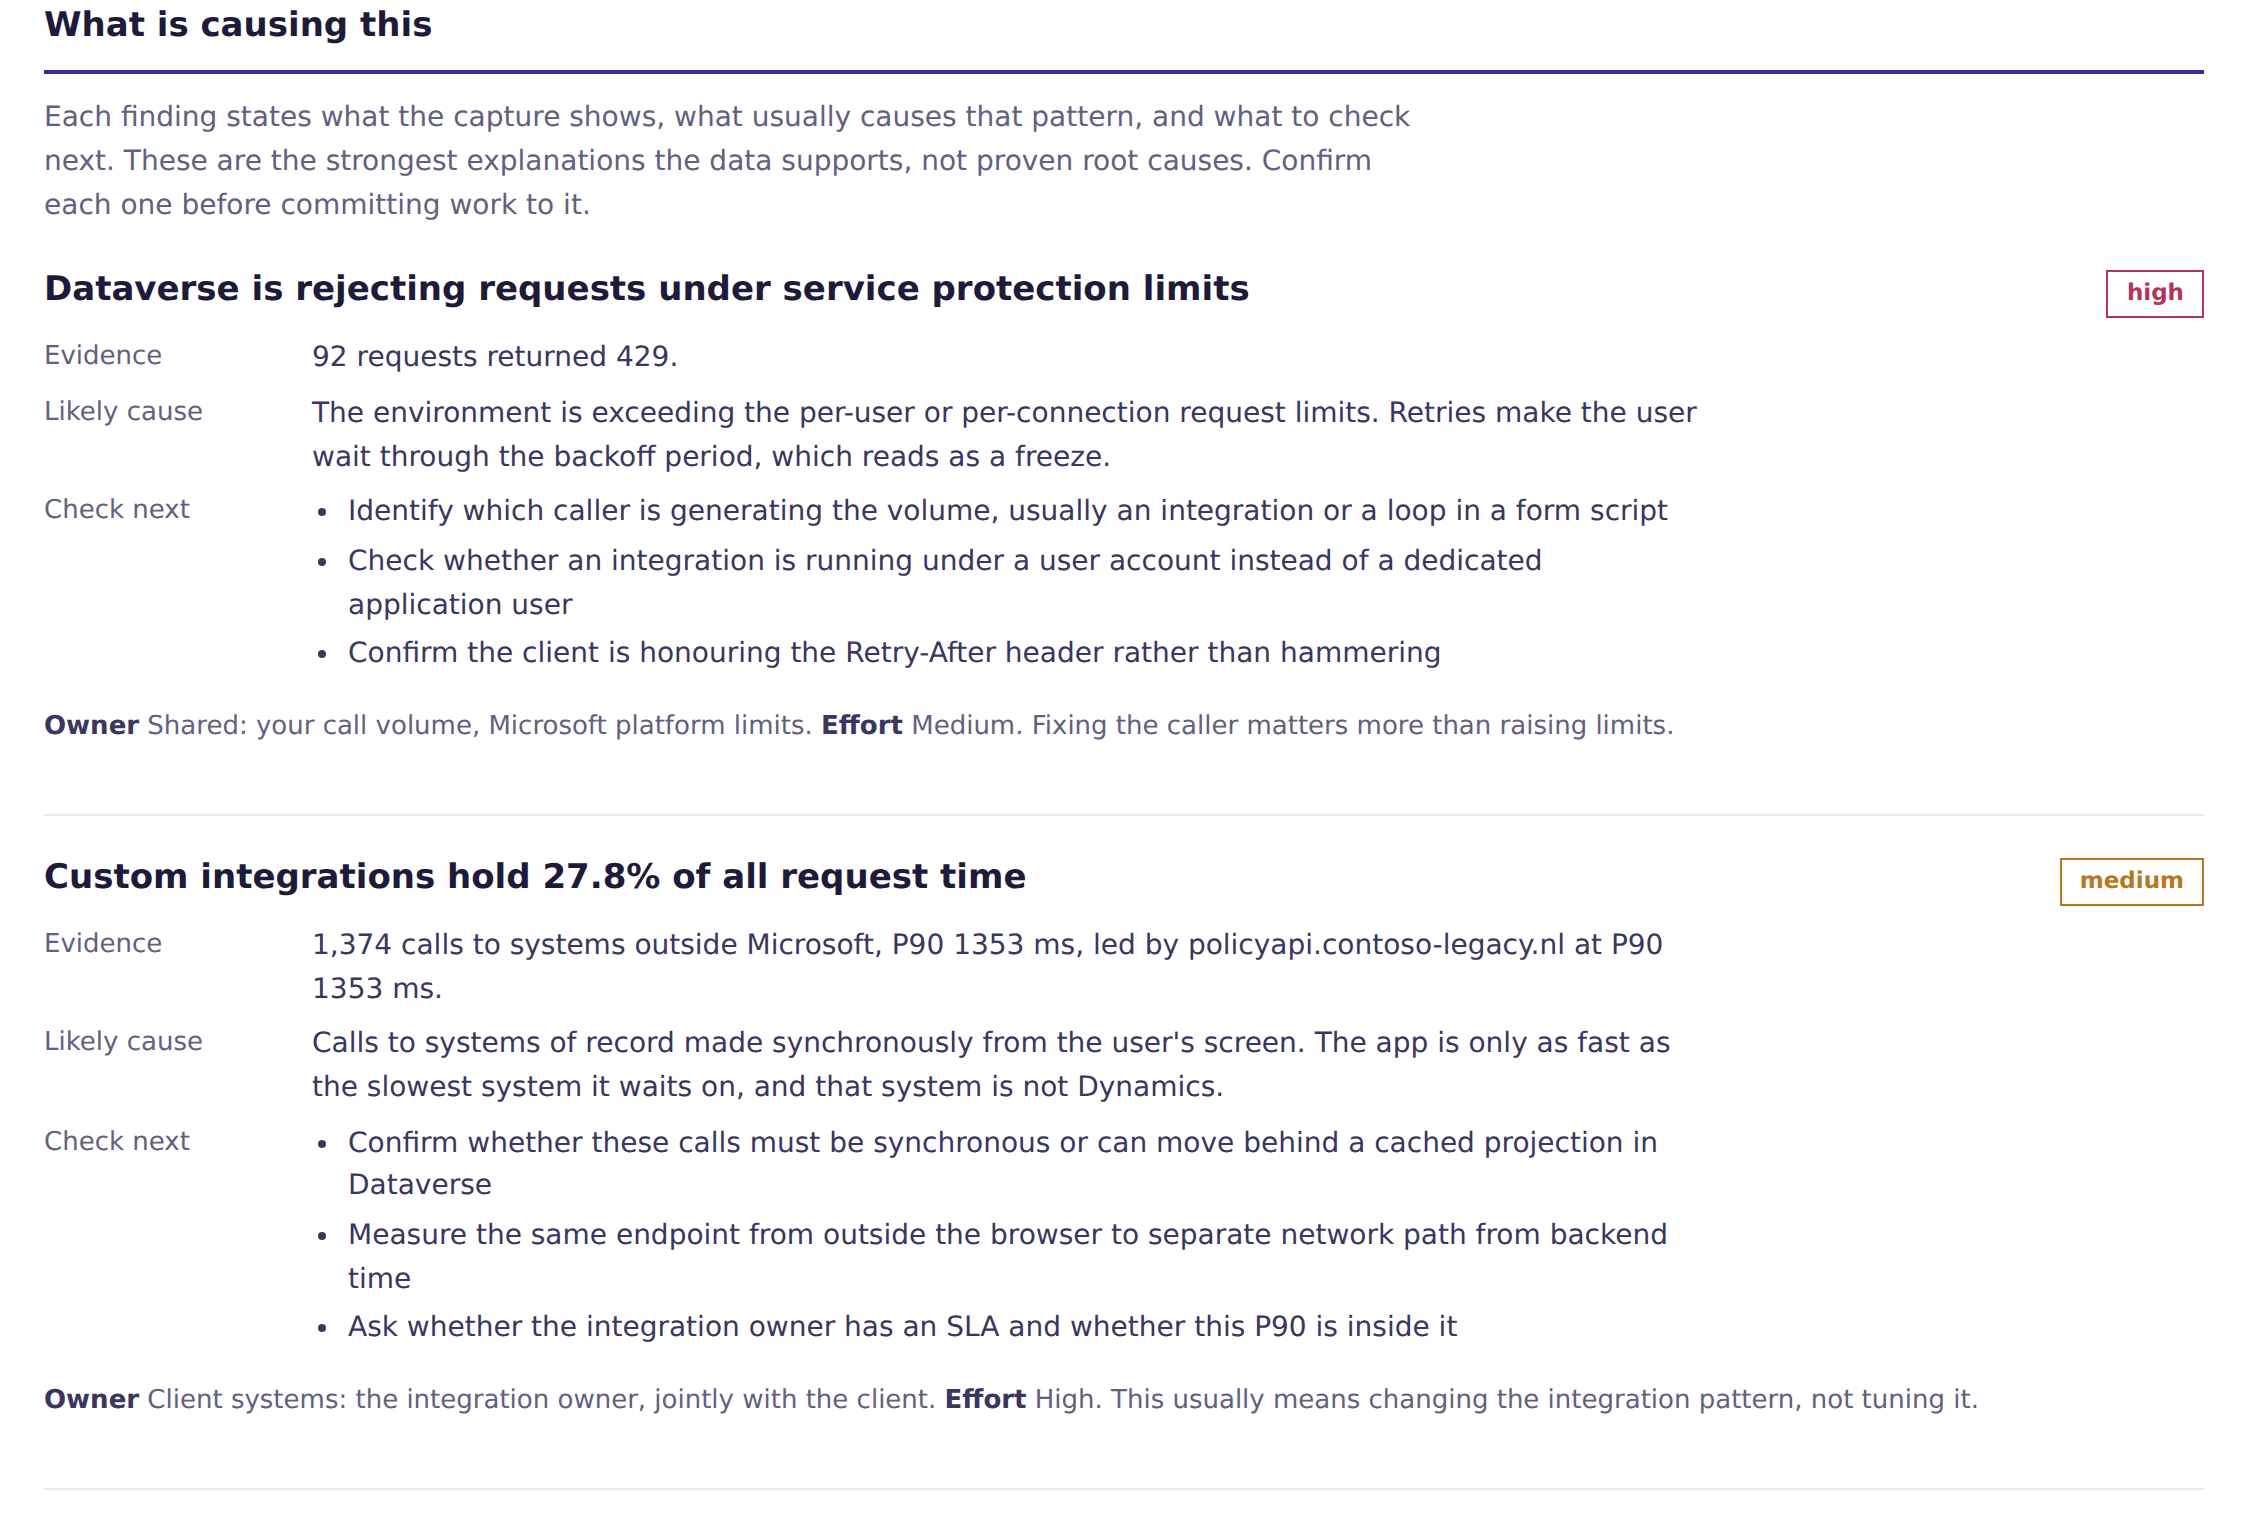
There are eleven rules. Custom integrations eating the request budget. Script blocking the browser for longer than the network does. Forms firing twenty requests every time somebody opens them. The same request going out twice inside one interaction. Dataverse throwing 429s. Endpoints that are fast at the median and awful at P99. Users clicking repeatedly and getting nothing back.
They are worded as likely causes on purpose. The tool sees timing, not source code. It can narrow "the system is slow" down to "look at these three things on this form", which is honestly the limit of what browser telemetry can tell you. Overstating that in front of a client architect gets the whole report thrown out, and rightly.
Below 30 interactions it refuses to run the rules at all and says so on the front page. Percentiles off five clicks are noise, and a report that hides that is worse than no report.
Who are you actually complaining to
This is the part I would have wanted years ago.
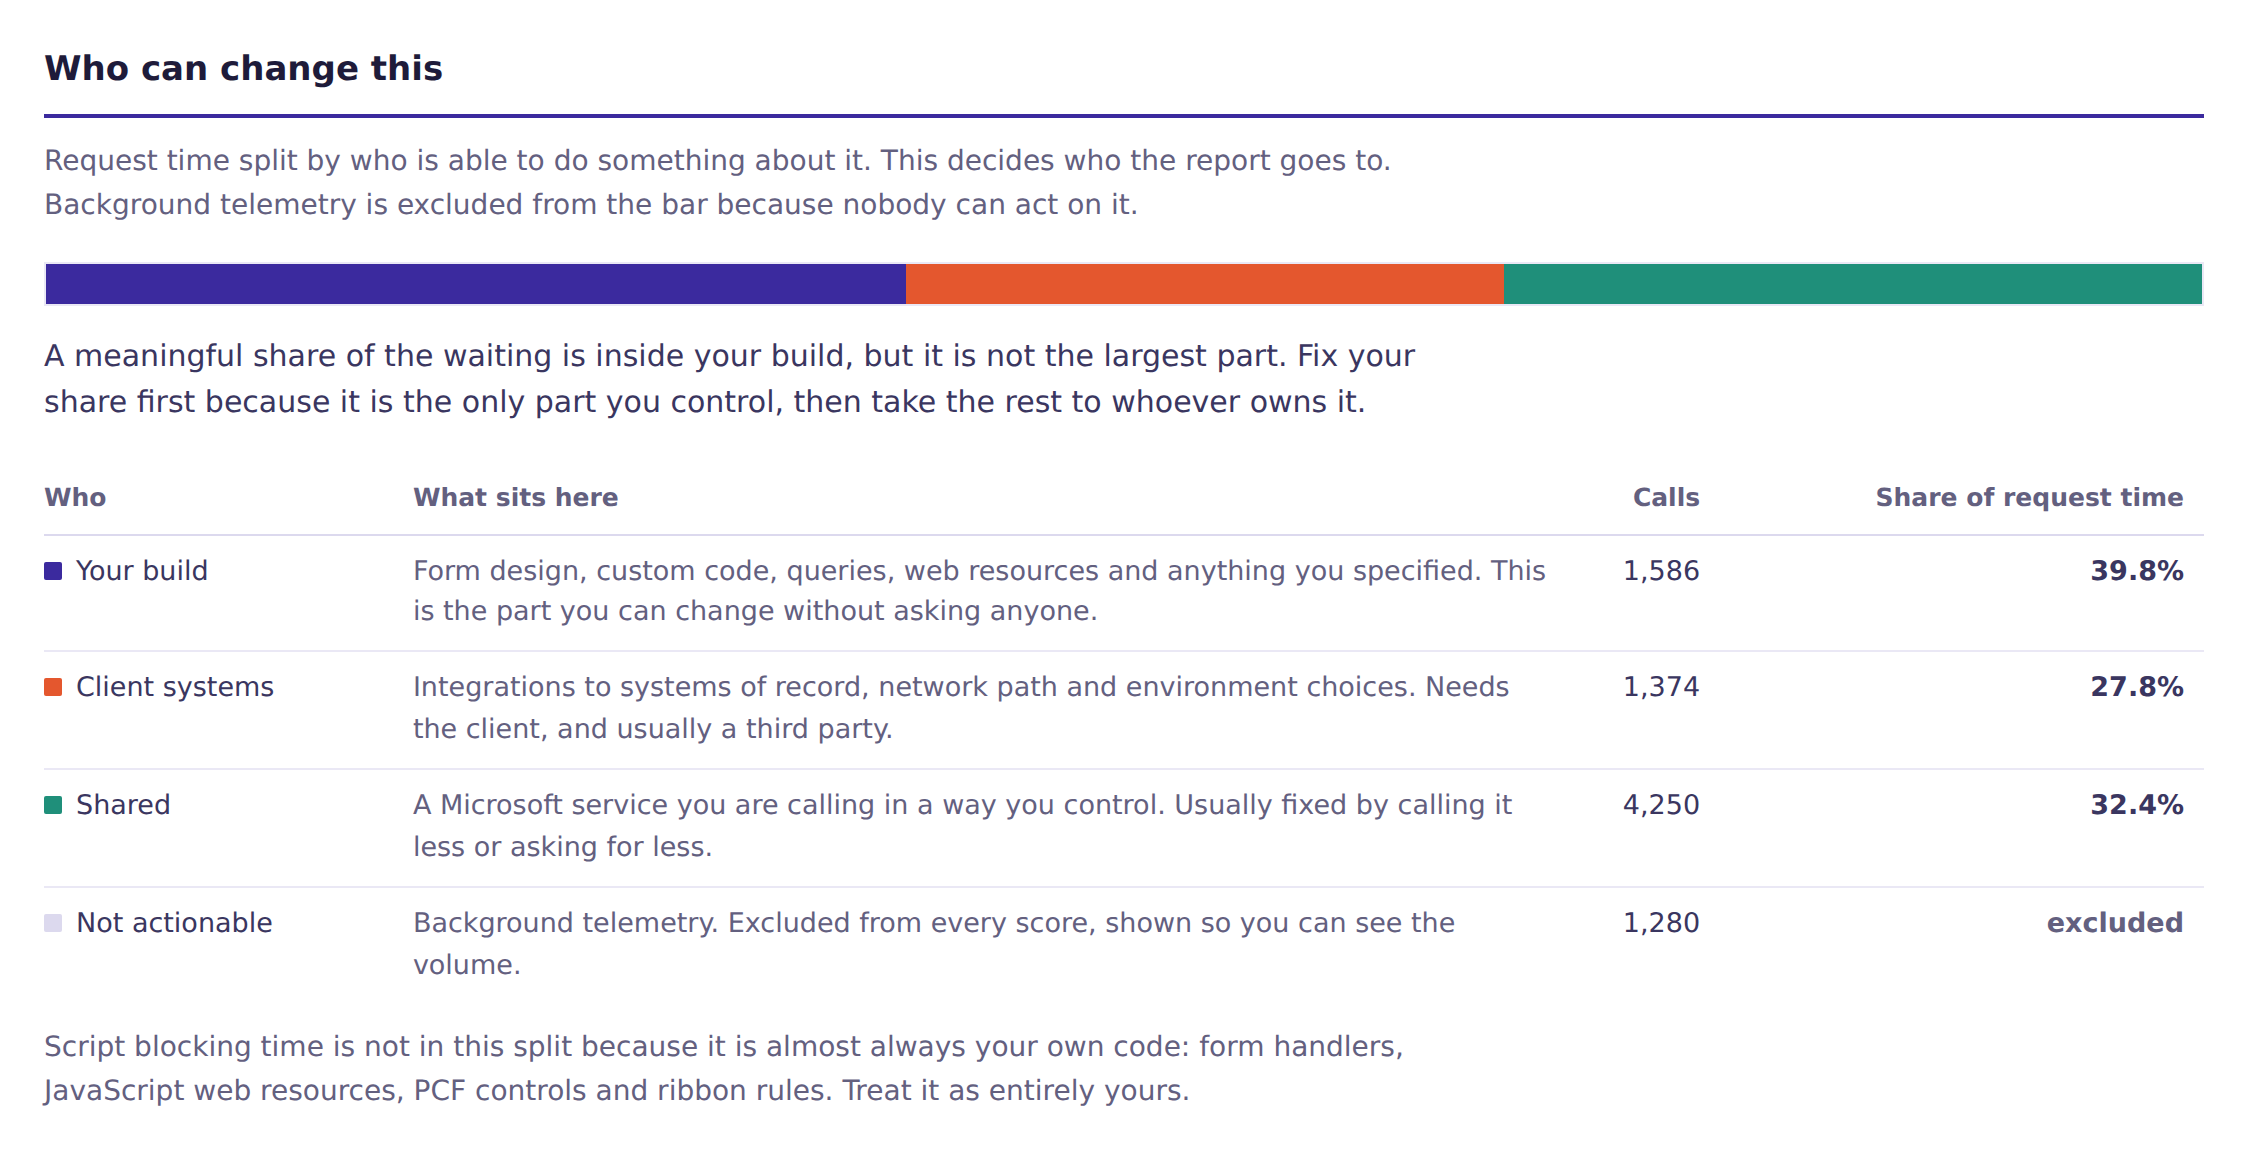
Request time gets split by who can act on it. Your build. Client systems. Microsoft platform. Shared. Not actionable.
Your build is form design, custom code, queries, web resources, flows. Nobody needs to approve anything, just fix it.
Client systems are the integrations to whatever system of record they run. Real, slow, and not yours to tune, although the pattern of calls into it usually is.
Microsoft platform is the shell, authentication, base Dataverse latency. You can call it less often. You cannot make it faster.
Shared is the honest one, and it is the bucket I argued with myself about. Dataverse, search, Copilot: Microsoft runs the service, but you decide what to ask it and how often. Filing that under "Microsoft" lets a badly built form off the hook. Filing it under "your build" promises fixes you cannot deliver. It needed its own bucket.
Script blocking time sits outside the split entirely. That is your code, near enough always. The platform does not run your form scripts for you.
Copilot configuration is a good example of why Shared exists. Open a form on a Copilot-enabled environment and you will see reads against msdyn_appcopilotconfigurations, msdyn_agentcopilotsettings, aiskillconfigs, msdyn_copilotskills, msdyn_copilotagentpreferences, msdyn_organizationprompts and msdyn_intententities. Seven endpoints, none of them yours, all of them triggered by choices you made about what to enable and where.
The rest of it
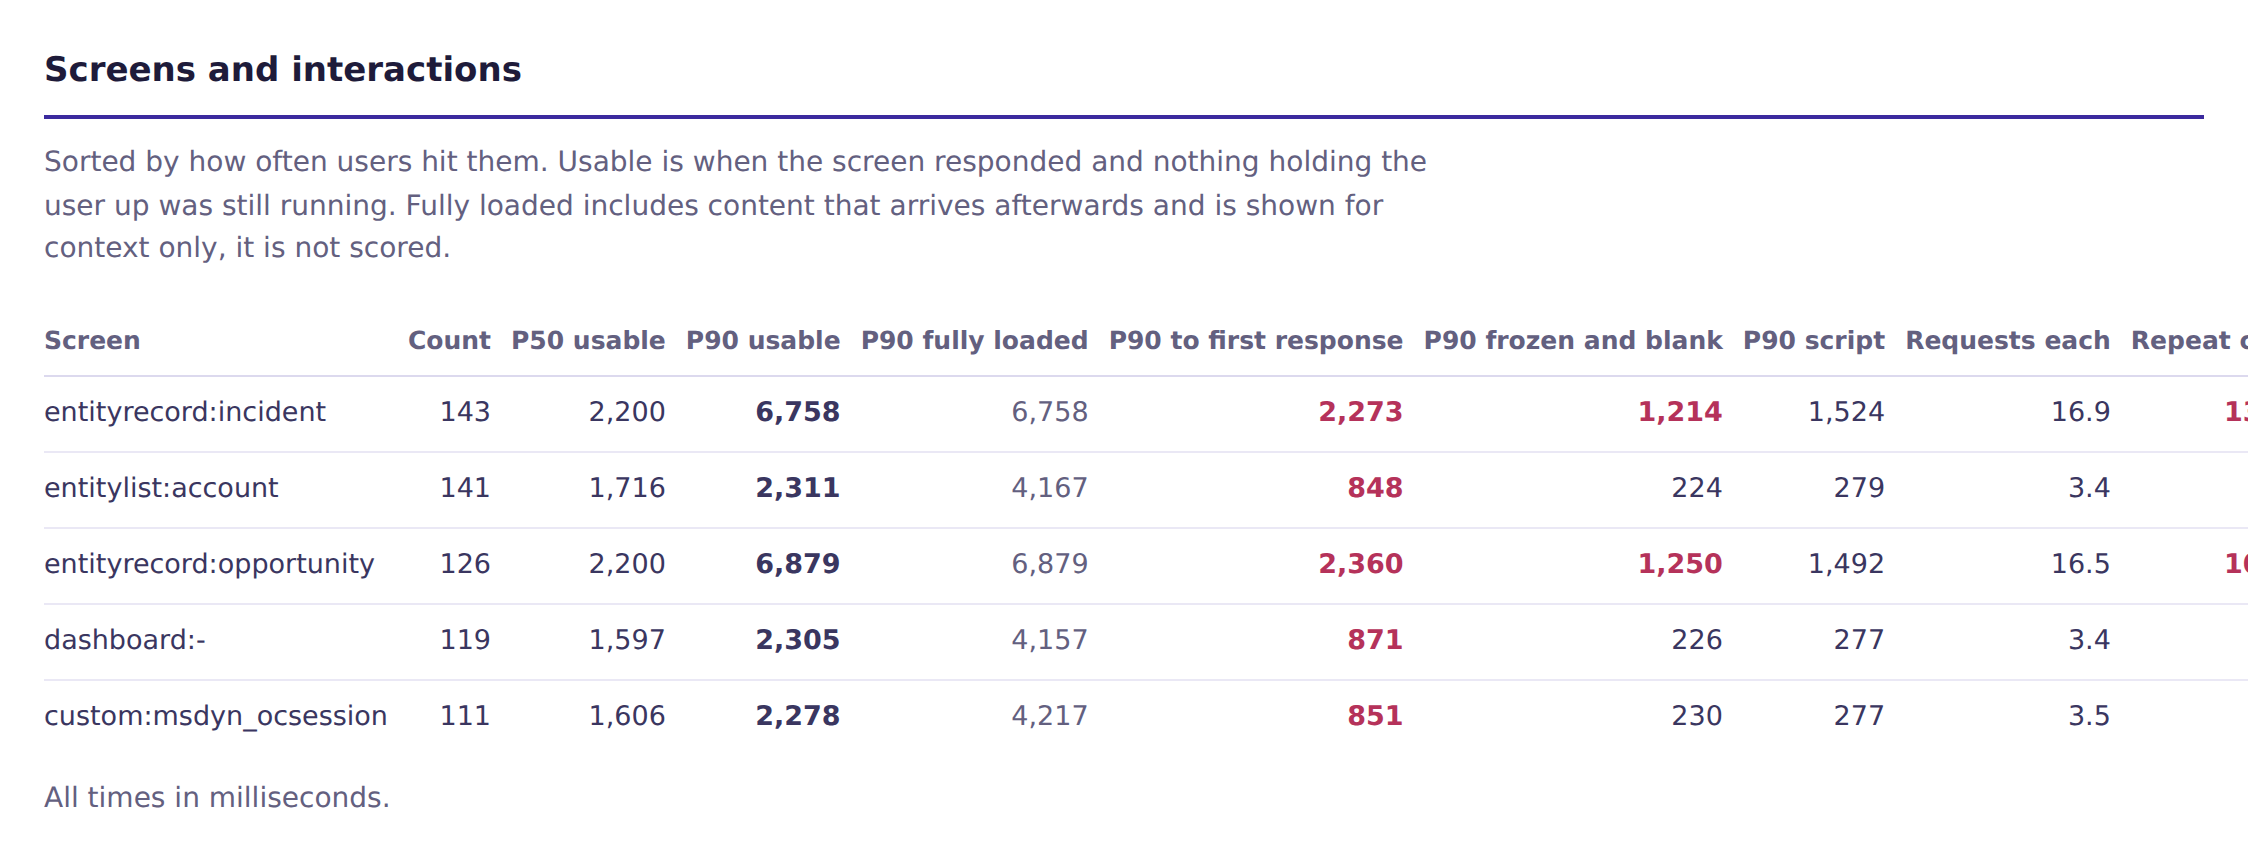
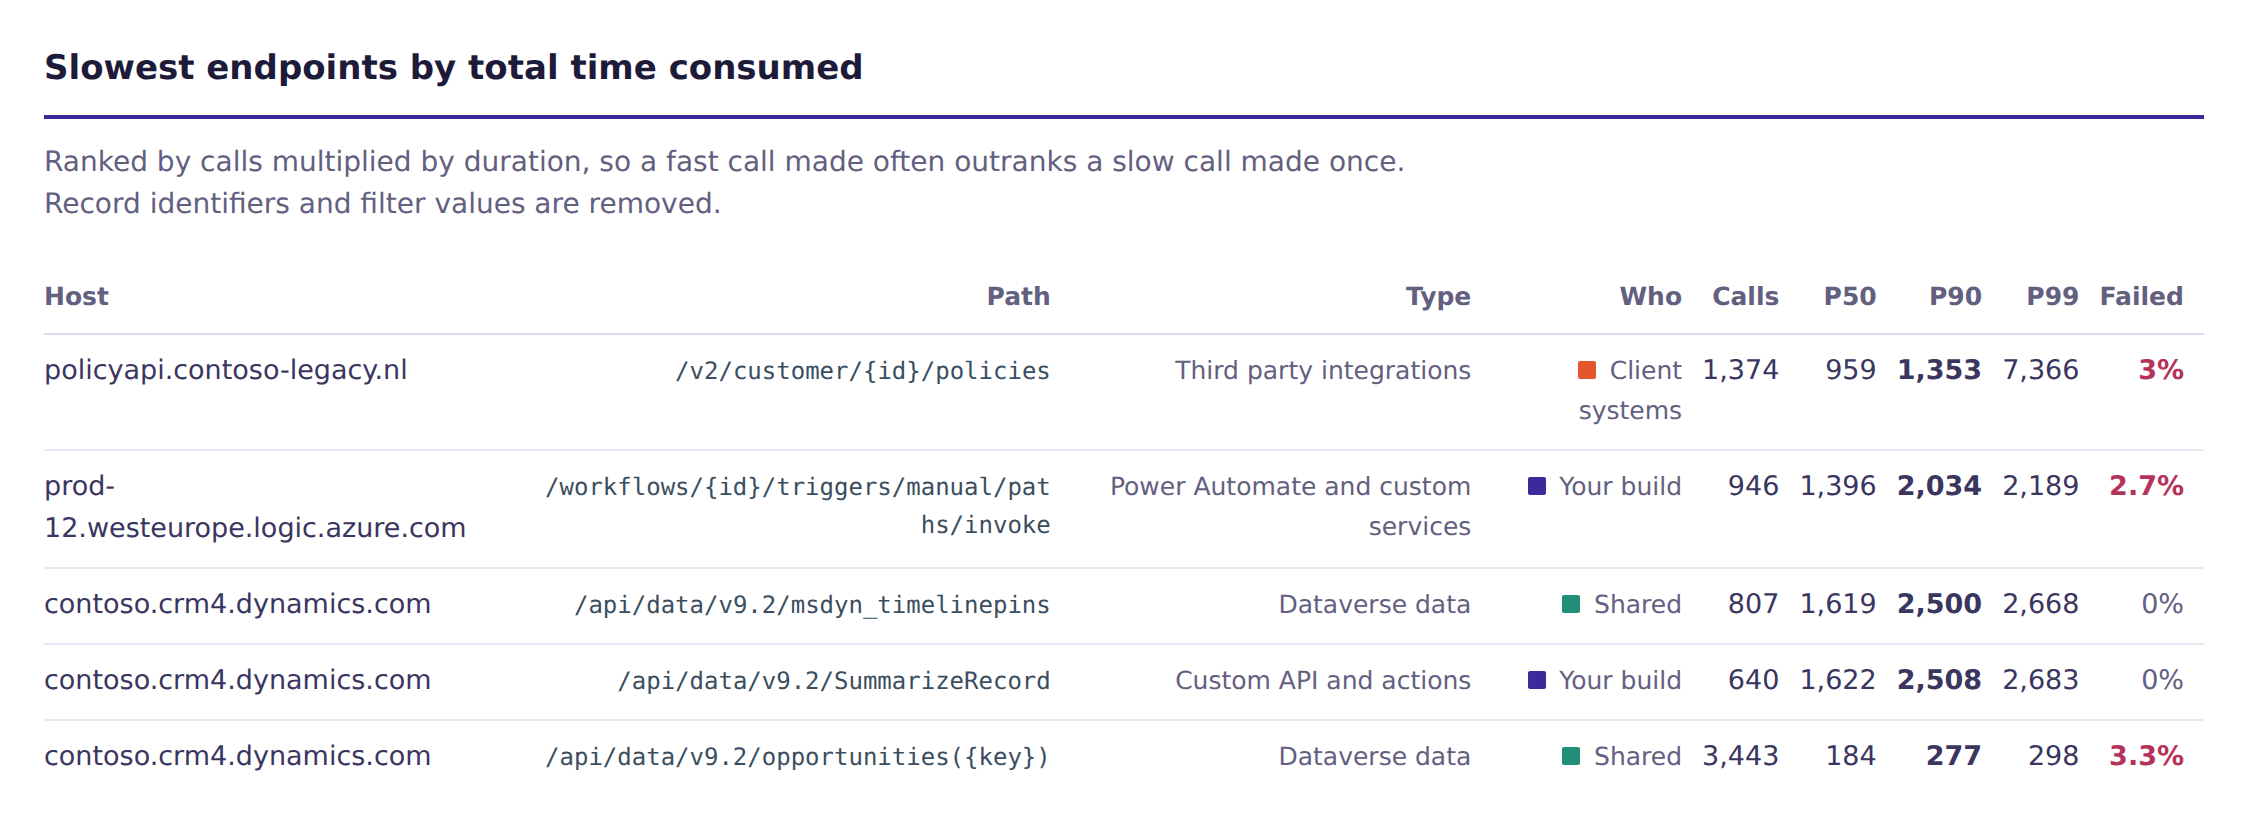
Every screen, ranked by how often people hit it, with time to usable next to time to fully loaded. Every endpoint, ranked by calls multiplied by duration, so a fast call made 400 times outranks a slow one made once.
Then the worst individual moments somebody had, ranked by how long the screen stayed unchanged rather than by total time. Those are the ones people remember and describe as the system hanging.
A glossary at the back explains every measurement in plain language, written for whoever receives the report rather than whoever built the system.
Using it
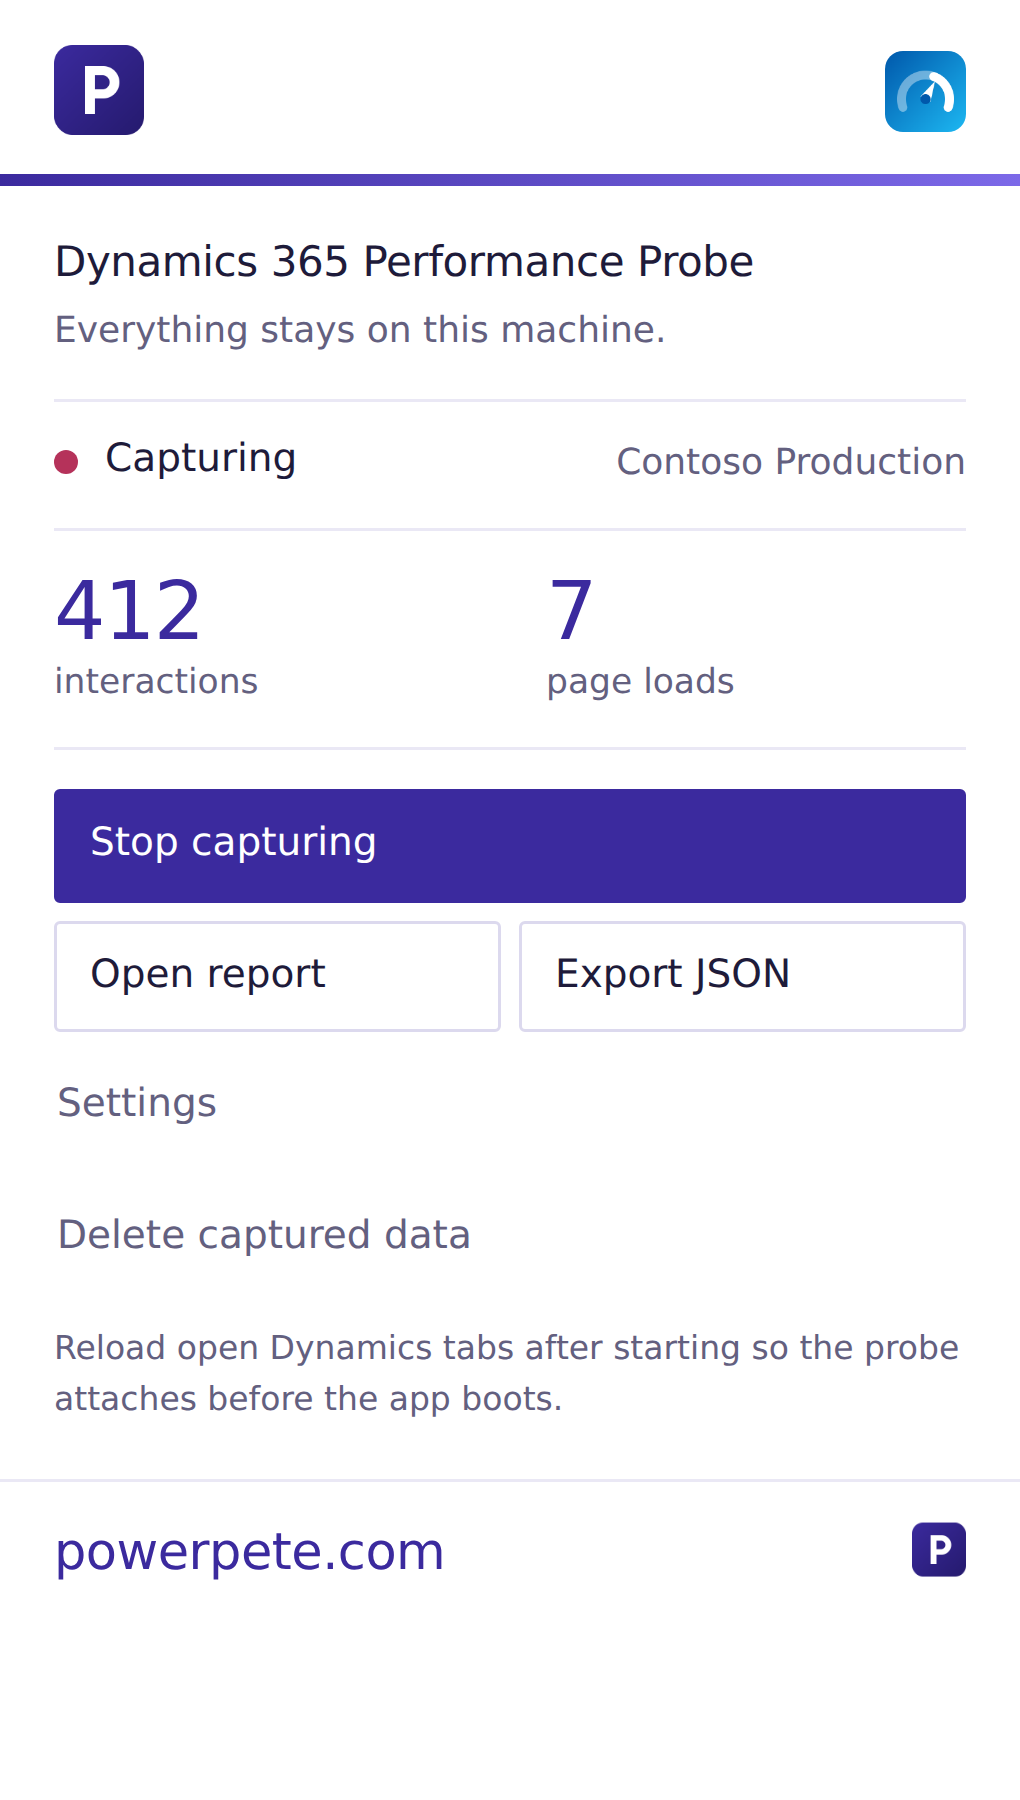
Install it unpacked, press start, reload your Dynamics tab, work normally for ten minutes, open the report. Export a PDF or a self-contained HTML file that opens offline with no extension installed.
The reload matters. The probe has to attach before the app boots, so anything already open only gets measured from halfway through.
Two things worth saying before anyone points it at a client. Redaction is on by default: record identifiers stripped, filter values replaced, signed-in user hashed, request bodies never read. And repeated clicking and unanswered clicks are behavioural data about real people. If you plan to push this to a fleet of machines, get the works council and DPIA question settled before you start, aggregate before you show anyone anything, and never report per named user. That conversation is short if you have it first and very long if you do not.
Have a go
It is on GitHub, MIT licensed.
Run it against your own environment and send me the capture, particularly if something in the output surprises you. Every capture from a different app sharpens the rules, and the background exclusion list only gets better with more real traffic through it.
I would rather have this argument with the tool than with a client.
Comments