
The Power Platform Solution Analyzer reads a Power Platform or Dynamics 365 environment and tells you three things: what is in it, how much of it is technical debt, and what it would cost to put right. It never writes to the environment, it names every check it could not run, and it now also knows whether your Dynamics 365 Contact Center can get a conversation to a person. Open source, MIT, and live at d365analyzer.com.
Try it at d365analyzer.com · Get it on GitHub
01 · "What have we actually got?"
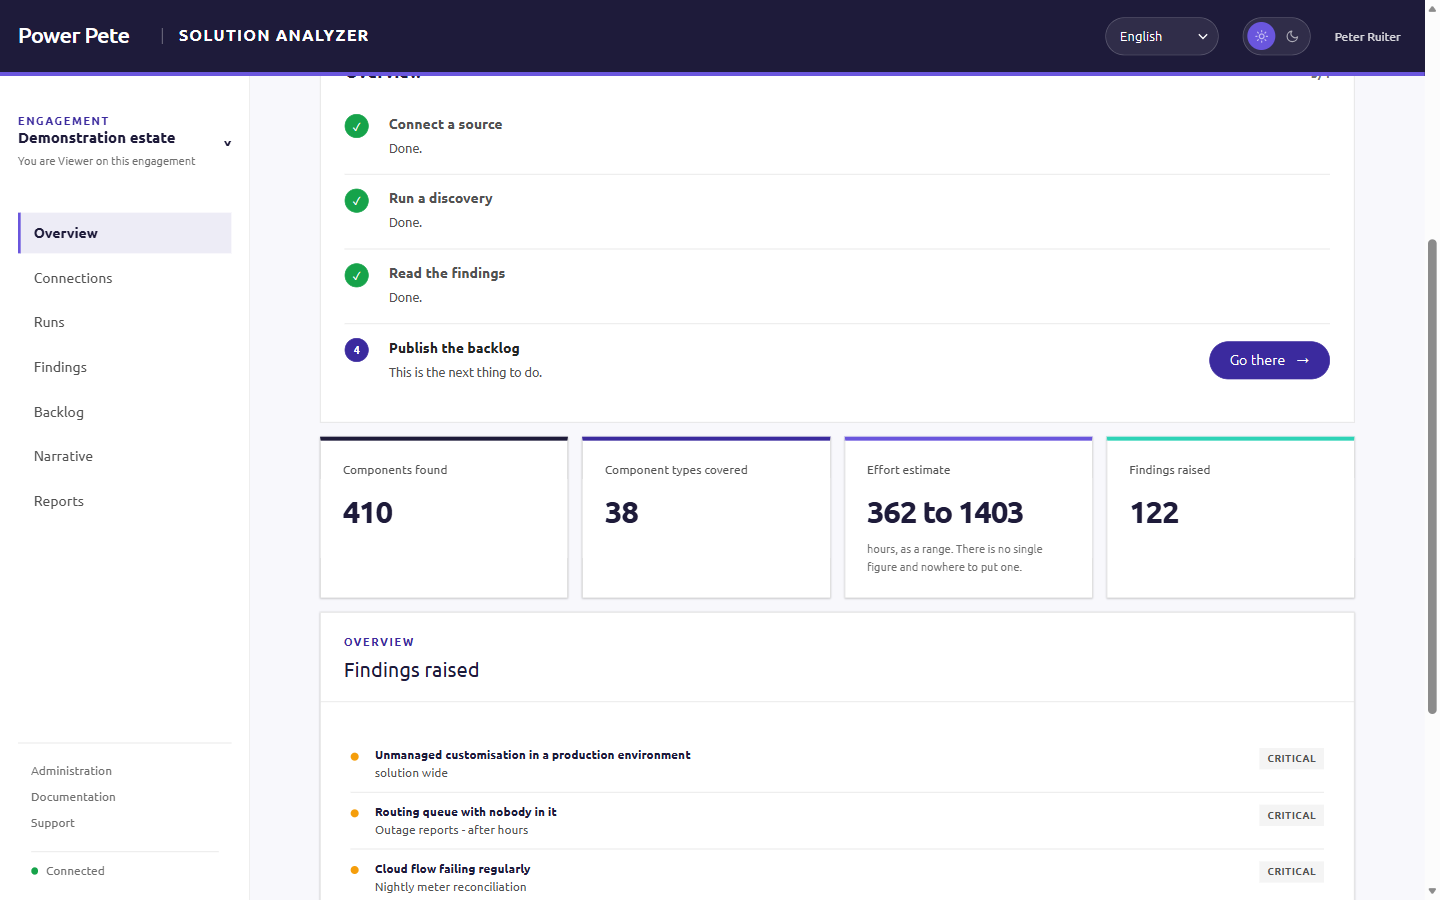
Every Power Platform engagement I have done starts with the same question, usually in the first meeting: what have we actually got? Nobody knows. Not because anybody was careless, but because the answer lives in fifty places. Flows in one maker portal, plug-ins registered by a contractor who left, a canvas app somebody built in the default solution three years ago that finance now runs month-end on, and environment variables that ship a production URL as their default value.
The Power Apps checker answers part of that question, and it answers that part well. It does not tell you that a cloud flow fails every night, that half the estate lives in the default solution, or that production is unmanaged and the environment itself is the source of truth. And it never tells you what any of it would cost to fix, which is the question the person paying for the engagement actually asked.
So the first week becomes a week of reading by hand, and what comes out is a spreadsheet only its author can interpret. That is the gap.
02 · What it is
A web app you point at an environment. It reads, it scores, it estimates, and it writes a backlog. Underneath is a .NET 9 API and a worker on Azure Container Apps, with every rule declared in a contract file rather than buried in code.
Three ways in
| Way in | Needs | Use it when |
|---|---|---|
| Application user, read only | An app registration and a read-only role | The engagement is repeatable |
| Interactive sign-in | Your own account | A workshop, with somebody watching |
| Exported solution file | Nothing | Week one, while the access request sits in a queue |
The modes combine. Whatever one of them cannot see, the report says it could not see, per check, by name.
Sixty checks, eleven categories
- Lifecycle and deprecation (4): what Microsoft is retiring and what you still run on it.
- Modernisation (2): classic workflows and dialogs that have a modern replacement.
- Build quality (8): the things a reviewer would send back.
- Architecture (4): cross-component debt, such as logic split between a plug-in and a flow.
- ALM and solution hygiene (7): unmanaged production, the default solution, hard-coded environment values.
- Governance (6): ownership, sprawl, orphaned components, premium connector exposure.
- Performance (7): synchronous plug-ins, flows that fail regularly, heavy forms.
- Security (4): privilege, secrets in definitions, organisation-level write.
- Operability (3): what will hurt the people running it at 3 a.m.
- AI components (7): Copilot Studio agents and AI Builder models, published, unpublished and forgotten.
- Dynamics 365 Contact Center (8): new, and the subject of section 04.
They cover 53 component types, from tables and forms to Copilot Studio agents. The Power Apps checker runs alongside, and its results are folded in under Microsoft's own rule ids rather than reimplemented. Everything is available in English, Dutch, German, French, Spanish and Italian, including the backlog it writes.
03 · Six rules it does not break
1. It never writes to the environment
Not in any mode, and there is no flag that changes it. A discovery is safe to run in the first conversation, which is the point. The only thing it ever writes is a backlog, to a tool you choose, containing only the items you ticked.
2. Unknown is not zero
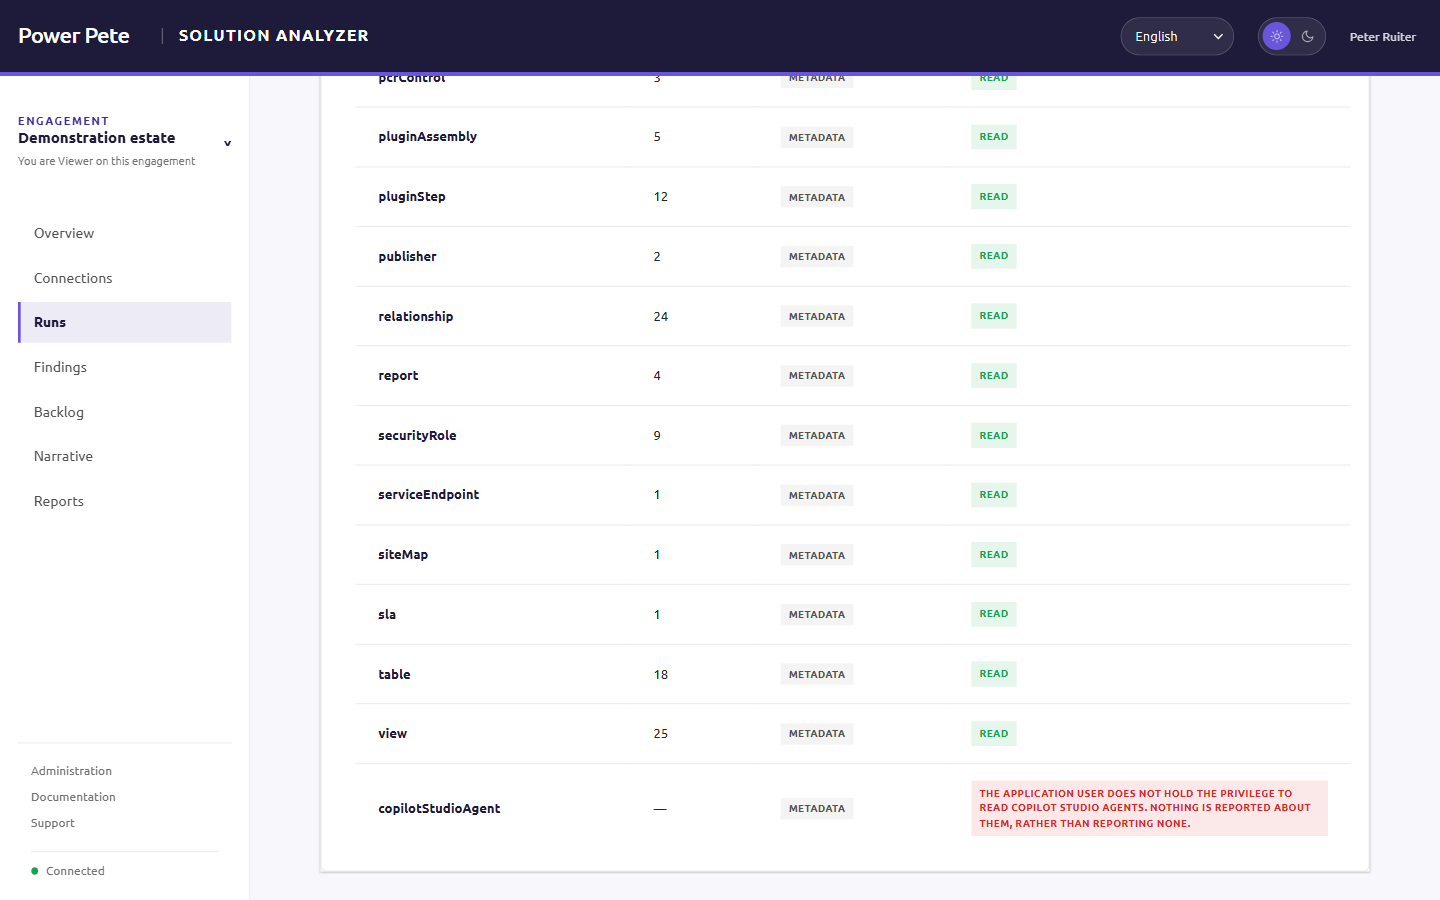
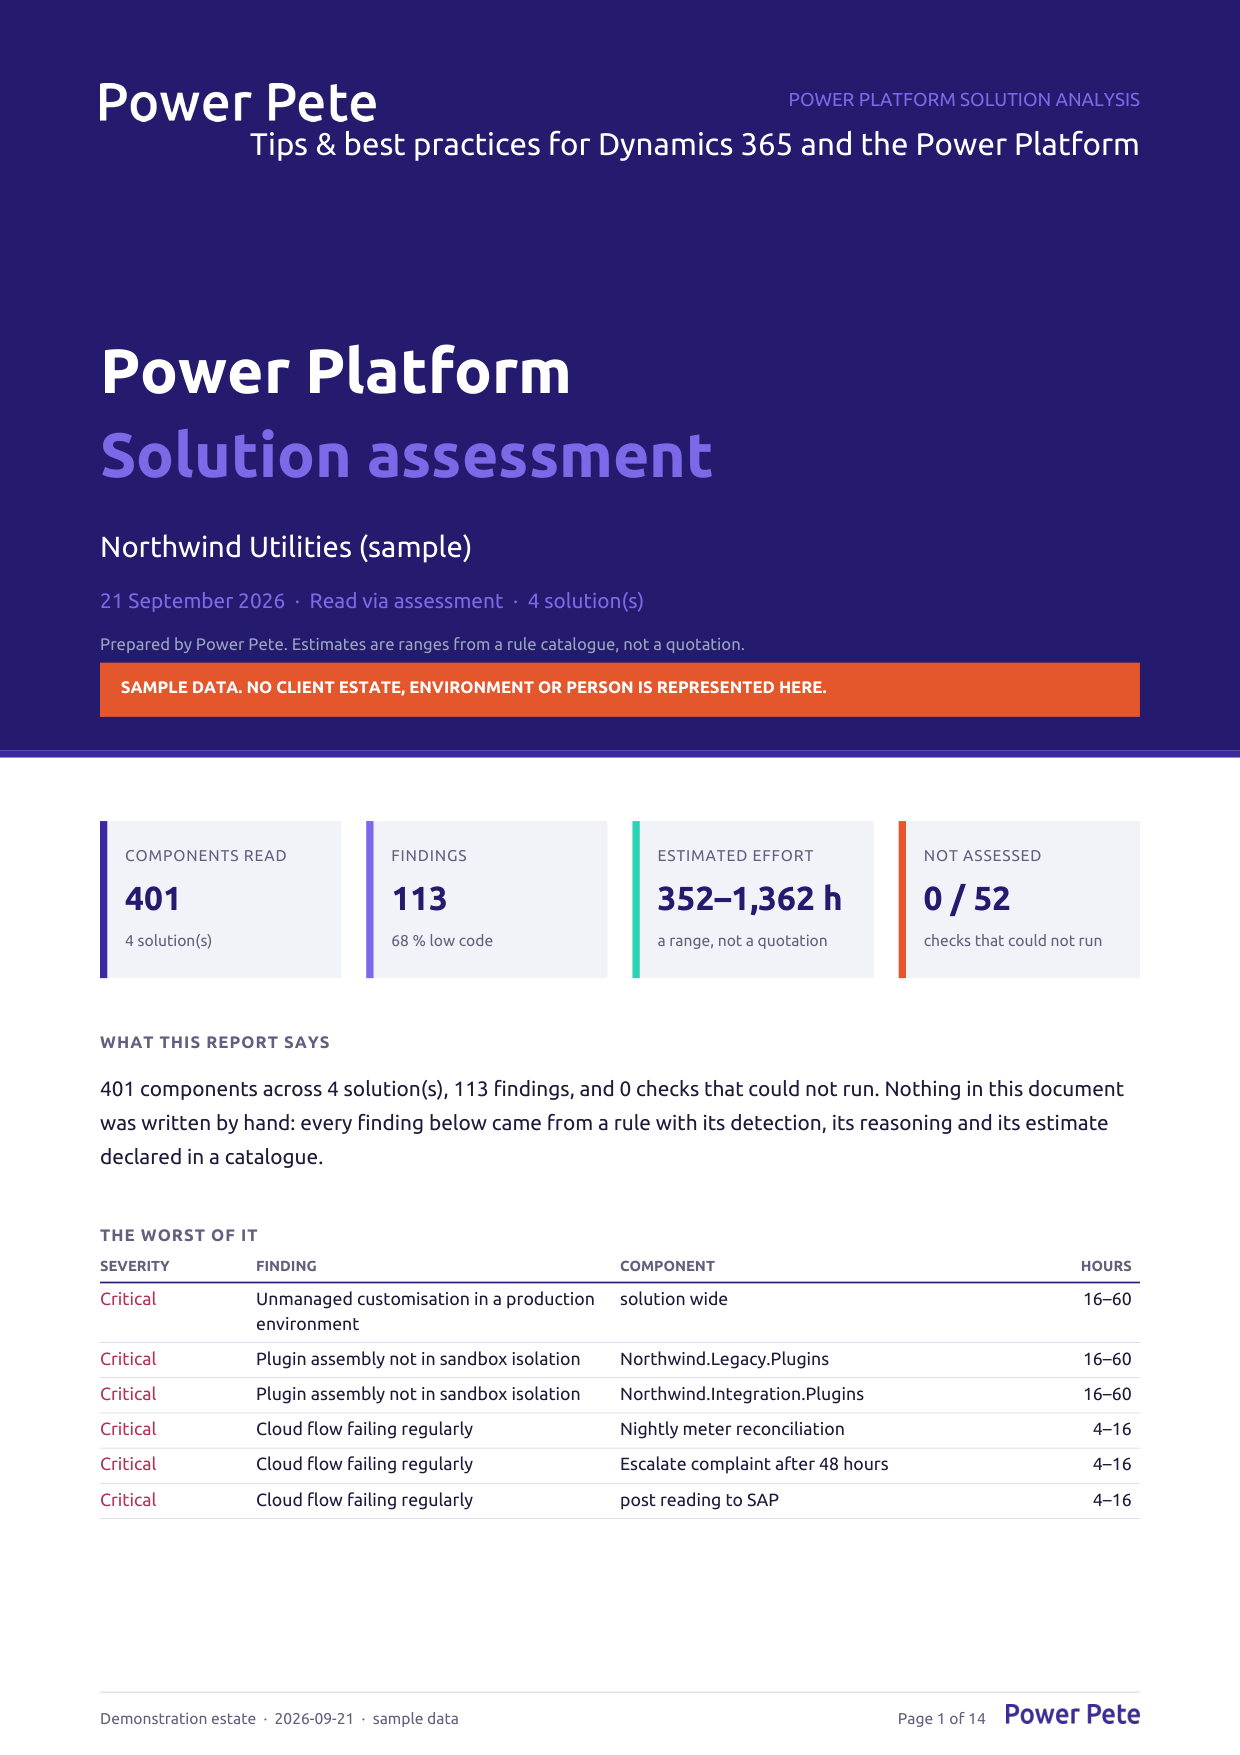
If a read fails, whether through a missing privilege, a table that is not installed or a throttled call, every check that depends on it is reported as not assessed, by name and with the reason. Nothing is ever reported as passing because nobody could read it. A report that covers four of nineteen solutions and one that covers all nineteen look identical on the cover page, so the first page of the report says which one you are holding.
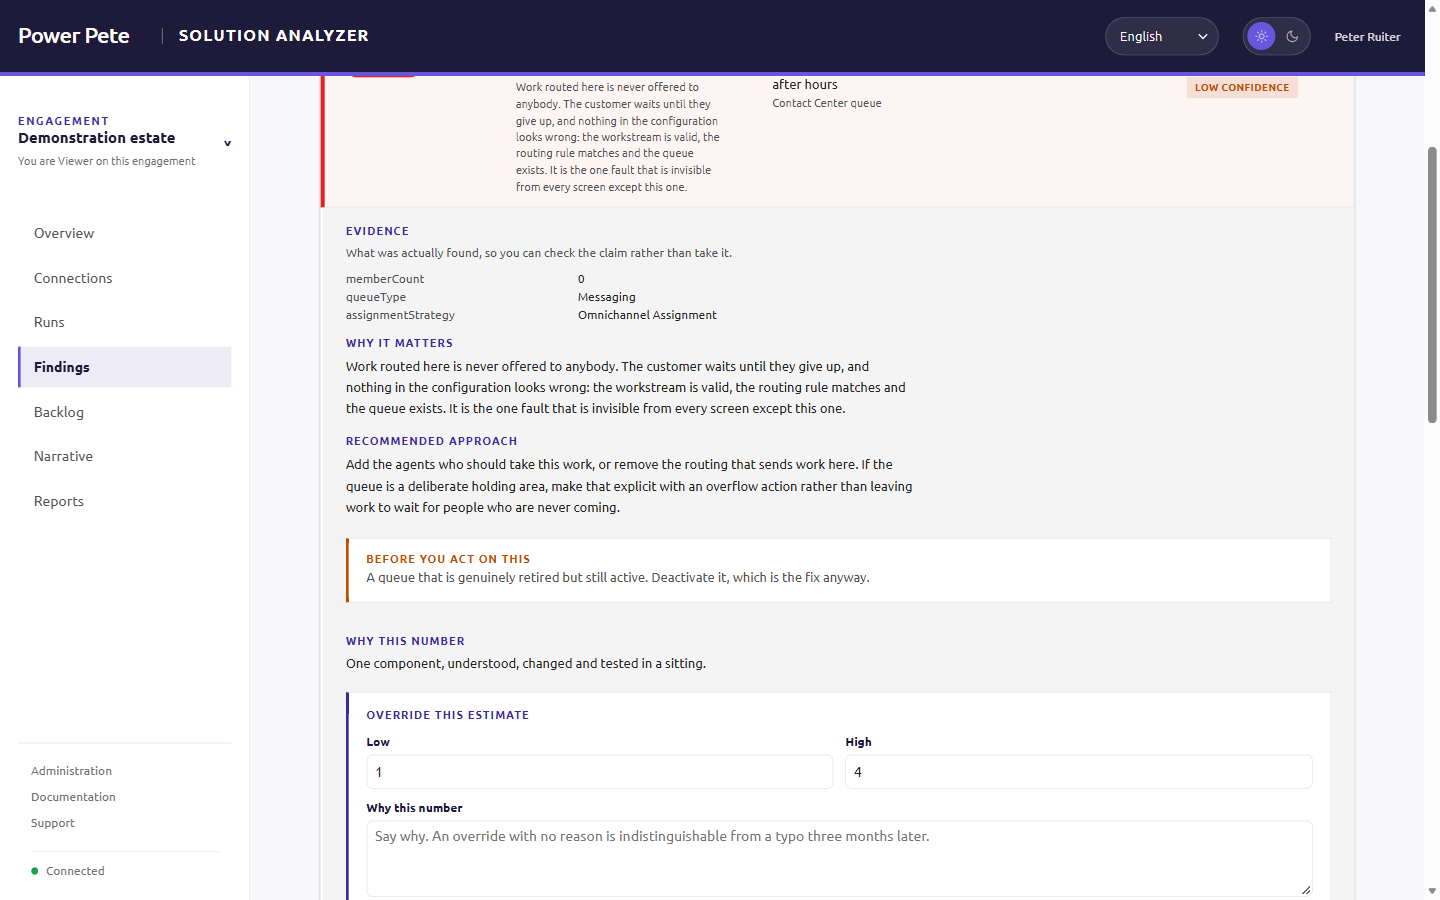
Every estimate is a range with a rationale, in three layers. Your own override beats a model estimate, which beats the band the check declares. The model estimates one finding at a time and records its prompt version and the hash of what it was shown, so any number in a report can be traced back to what produced it.
💡 There is no single figure anywhere. A low and a high, each with a reason. The database has nowhere to put a point estimate, because a single figure is a decision somebody takes and owns, not a number a tool produces.
4. Microsoft's rules stay Microsoft's
The Power Apps checker is maintained by Microsoft and its rules move. So the analyzer calls it and keeps its results under their own ids. The checks declared here are the ones the checker does not have: lifecycle, cross-component debt, usage, sprawl and solution hygiene.
5. Every finding shows its evidence
Not "this queue is misconfigured", but memberCount: 0, queueType: Messaging. You can check the claim rather than take it, and each finding says what to look at before you act on it.
6. Publish twice, get one copy
Every work item carries a deterministic key derived from the engagement, the check and the component, so a second publish updates what is already there instead of creating a second copy. A dry run shows what would land without writing anything.
04 · Now with Dynamics 365 Contact Center
The newest category asks a question that no screen in the product answers on its own: when a conversation arrives, does it reach anybody?
It starts by finding out whether there is a contact centre to check. It asks Dataverse's metadata whether the workstream table exists. If it does not, the run says Contact Center is not installed and moves on. If the answer is anything other than a clear yes or no, the checks are reported as not assessed rather than quietly passing.
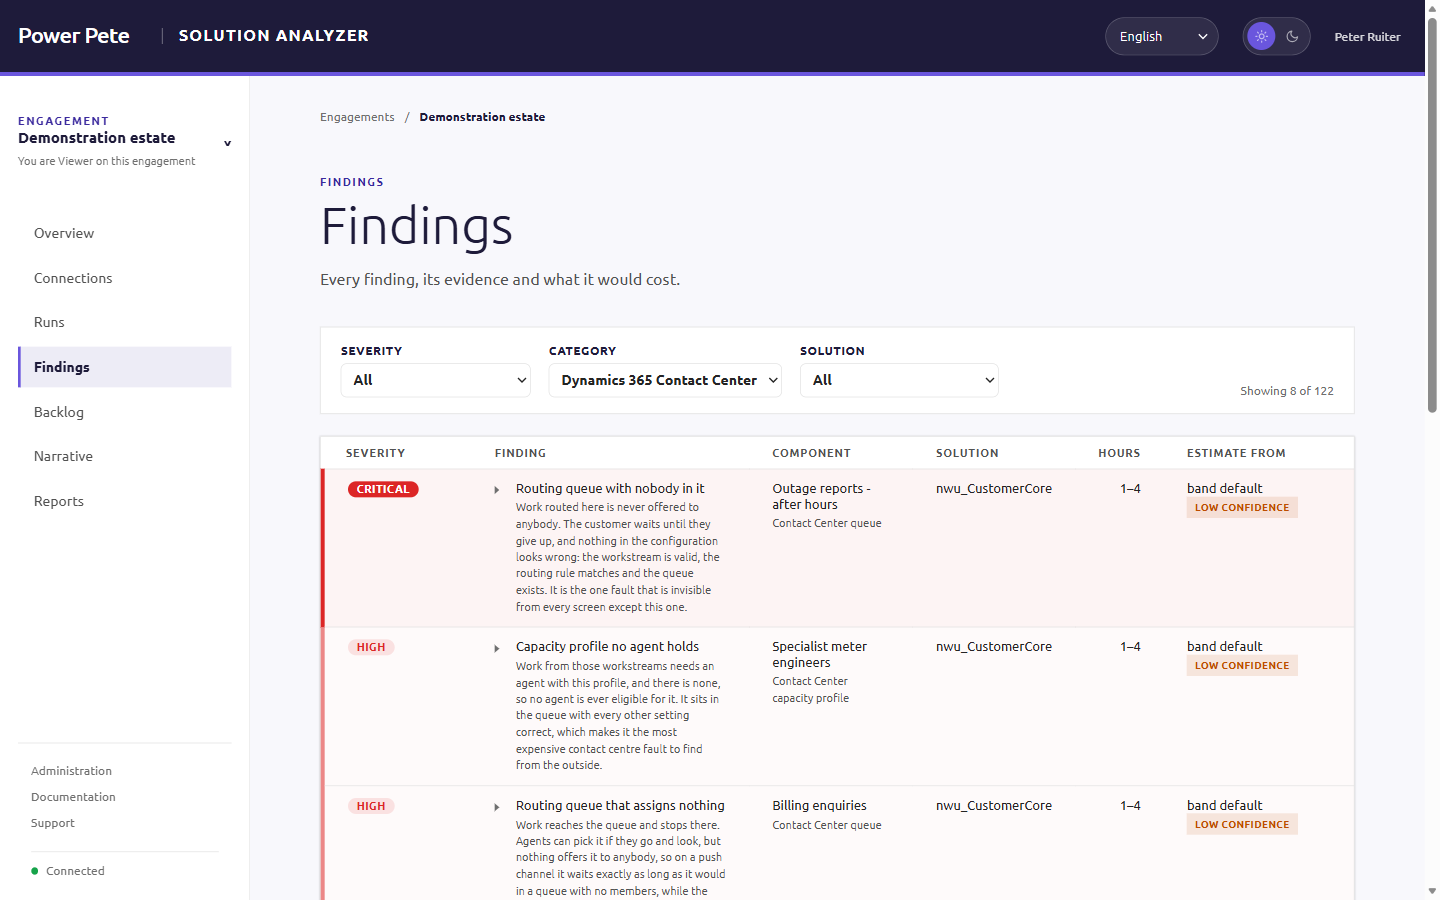
Then it reads workstreams, routing queues and capacity profiles, and runs eight checks:
| Check | Severity | What it catches |
|---|---|---|
| Routing queue with nobody in it | Critical | Work routed to a queue with no members. Microsoft's own FAQ says a conversation assigned to a queue without representatives is closed automatically. |
| Routing queue that assigns nothing | High | Assignment set to No Assignment: work arrives and waits for somebody to go and pick it. |
| Capacity profile no agent holds | High | A workstream requires a profile that no agent has, so nobody is ever eligible for that work. |
| Queue with no overflow handling | Medium | Full, out of hours or waiting too long, and nothing happens: the customer waits. |
| Queue with no operating hours | Medium | Open around the clock as far as routing knows, so work arrives at 3 a.m. and waits until nine. |
| Queue with no service level | Low | Service-level reporting for the queue measures against nothing. |
| Workstream with no fallback queue | Low | Unmatched work lands in the system default queue, answered by whoever is free. |
| Capacity profile that blocks for the rest of the day | Info | An agent who reaches the limit is blocked until tomorrow rather than until they finish something. |
Unknown stays unknown here too. A queue whose member count did not come back is not a queue with nobody in it, and a capacity profile whose holders could not be counted is not one that nobody holds. A critical finding on configuration that is actually fine, raised because of a permission on a table nobody thinks about, would be read by exactly the people who know immediately that it is wrong.
05 · From findings to a backlog
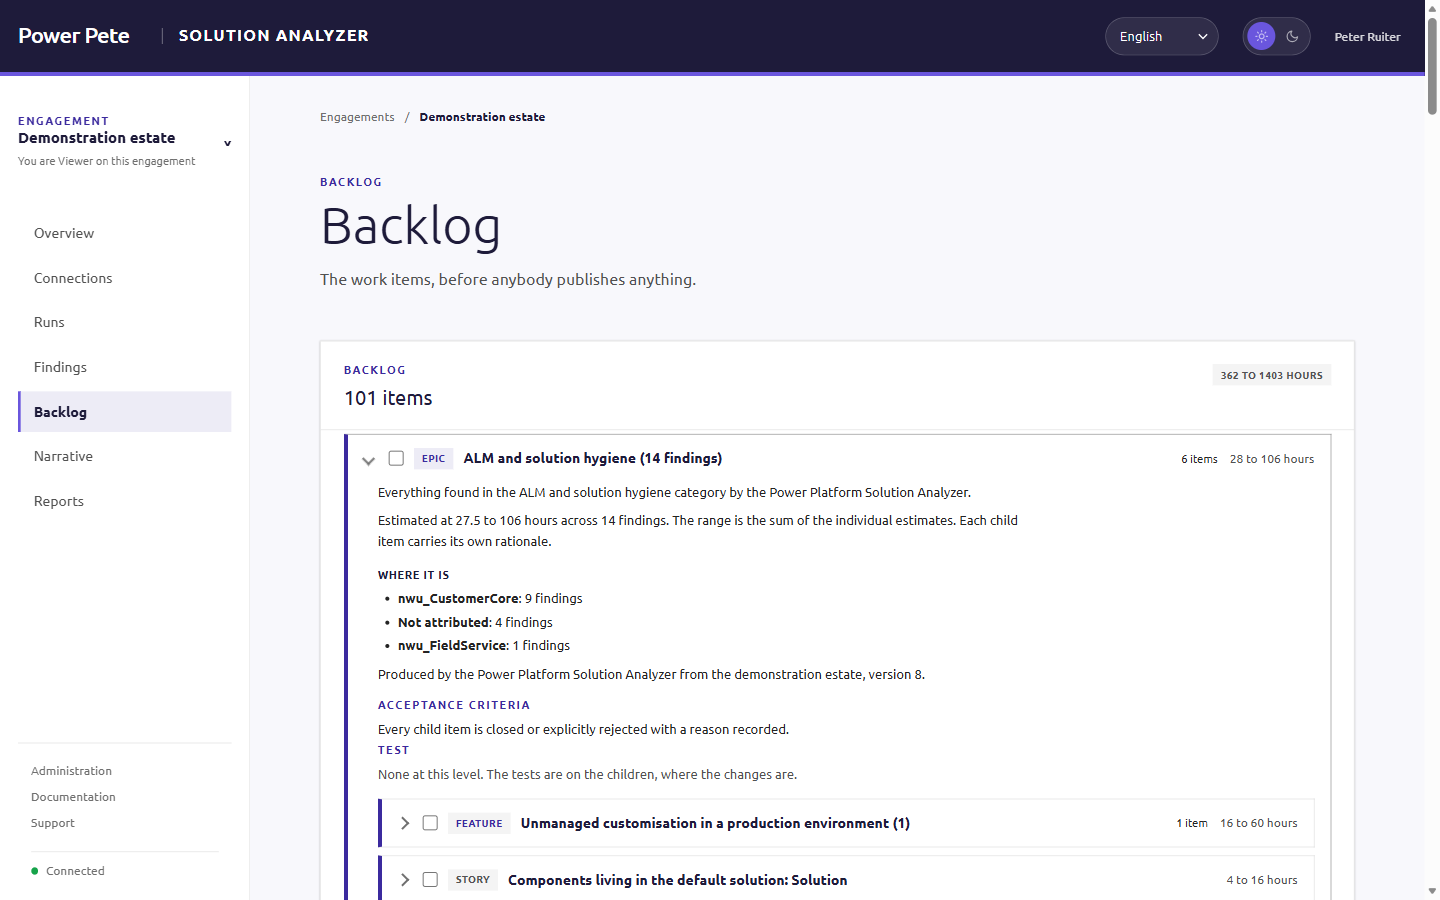
A finding nobody acts on is a finding nobody needed. The backlog groups findings into an epic per category with a work item per finding underneath. Every item carries acceptance criteria, a test requirement and its estimate range. You publish it to Azure DevOps, Jira or GitHub Issues: only the items you tick, and the same items update rather than duplicate the next time.
The report is the other half. A PDF a client reads, with its limits on page two rather than in an appendix, and an Excel workbook with one sheet for each thing a consultant filters on.
06 · What it will not tell you
- It is not a licensing assessment. It reports where a premium connector is used and stops there. It cannot see what the tenant holds, and guessing would be worse than silence.
- It is not a penetration test. The security checks are about privilege, secrets in definitions and organisation-level write, not about whether the estate can be broken into.
- It does not fix anything. There is no remediation mode and no plan to add one. Everything it produces is a recommendation, a report or a work item for somebody who will do the work themselves.
07 · Try it
There are two routes.
Hosted. Go to d365analyzer.com and sign in with a work or school Microsoft account. The demonstration estate is there from the first screen, so you can read the findings, open the backlog and download the report before you connect anything of your own. What it stores, and for how long, is on the privacy page.
Your own. Clone it and run the offline path, which needs no environment and nobody's permission:
# Check every contract against every other before anything is generated
./build/Test-Contracts.ps1

# Contracts to code, then build and test
./build/Invoke-CodeGen.ps1
dotnet test

# A synthetic solution export with sixteen deliberate findings in it
./build/New-SampleSolution.ps1
The first-run walkthrough in docs/03-first-run.md is written for a consultant who has never touched Azure, and it covers deploying it into your own subscription.
MIT licensed. Sixty checks, six languages. No strings.
Built to be reused across engagements rather than for one client, which raises the bar on honesty about what it could not see. Fork it, run it, file an issue, or tell me which finding is wrong.
Comments